Thinking about how a problem can be solved (2 steps):
Example of abstraction:
At its most abstract level, a computational problem can be represented by a simple diagram:
--input--computational problem --- output-
input: the information relevant to the problem
output: the solution to the problem, which could be passed back from a subroutine
Suppose that a pseudocode algorithm has been written to find the maximum of a list of numbers:
function maxInt(listInt)
    maxNumber = listInt[0]
    for i = 1 to len(listInt) – 1
        if listInt[i] > maxNumber then
            maxNumber = listInt[i]
        endif
    next i
    return maxNumber
endfunction
If the function is called with an empty list, it will crash on the statement maxNumber = listInt[0]. To prevent this, a precondition must be specified:
Computer science is the study of abstraction. Abstraction allows us to separate the physical reality of a problem from the logical view. Procedural abstraction means using a procedure to carry out a sequence of steps for achieving more tasks, such as calculating a student’s grade from her marks in three exam papers.
Most computational problems beyond the trivial need to be broken down into sub-problems before they can be solved. Think of any system which starts off by the user with a menu of choices. Each choice will result in a different, self-contained module.
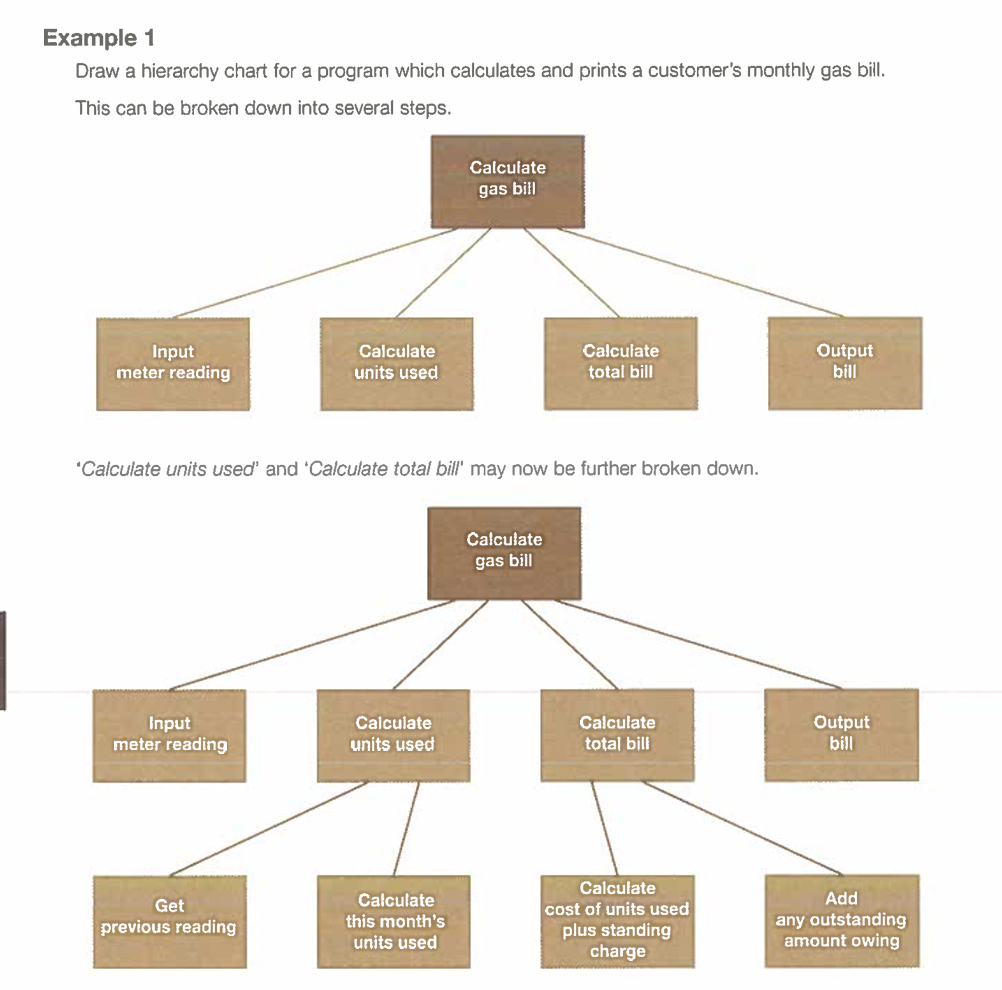
Top-down design is the technique of breaking down a problem into the major tasks to be performed, each of these tasks is then further broken down into separate subtasks that are sufficiently simple to be written as a self-contained module or subroutine.
As well as making the task of writing the program easier, breaking a large problem in this way makes it very much simpler to test and maintain. When a change has to be made, if each module is self-contained and well-documented with inputs, outputs, and preconditions specified, it should be relatively easy to find the modules which need to be changed, knowing that this will not affect the rest of the program.
A hierarchy chart is a tool for representing the structure of a program, showing how the modules relate to each other to form the complete solution. The chart is depicted as an upside-down tree structure, with modules being broken down further into smaller modules until each module is only a few lines of code.